Getting Started with Node.js
The Node.js version of KillrVideo is a reference application for Node developers looking to learn more about using Apache Cassandra and DataStax Enterprise in their applications and services. It contains sample code that uses:
- The DataStax Node.js Driver for Cassandra
- Google's gRPC
These instructions assume you already have Node.js and npm installed, as well as an IDE that supports debugging with source maps like WebStorm or Visual Studio Code on your local machine.
Node.js v6.12.3 is confirmed to work with this version of KillrVideo. You can find the download link here.
Cloning and Setup
Like all KillrVideo implementations, the Node.js version uses Docker to run all its dependencies in your local development environment. If you haven't already, please read and follow the instructions in Getting Started to install Docker. Once you have Docker up and running, follow these steps:
- Clone the Node.js project's GitHub repository:
> git clone https://github.com/KillrVideo/killrvideo-nodejs.git - From the root of the repository, use
npmto install all dependencies:> npm install We use
npmscripts defined in the project'spackage.jsonto do our build (i.e. transpile JavaScript, copy.protofiles to the correct location, etc). Run a build now by doing:> npm run buildYou should end up with the build output in the
distfolder.Setup the Docker environment for the first time by running:
> ./setup-docker.shOr on Windows:
> .\setup-docker.batThis should create a
.envfile with some environment variables, as well as pull all the Docker images that the application needs to run.Start the docker dependencies that you just pulled down via
docker-compose:> docker-compose up -dThis starts up things like a DataStax Enterprise node, the Web UI, etc. You can learn more about how we use Docker in our Docker Guide documentation.
Running the Code
Now that you've got the environment setup and the project built, you can run the project and
explore the code in your IDE of choice with a debugger attached. The transpiled JavaScript
code (i.e. build output) is in the dist folder and the main entry point of the application
is dist/index.js. Because the code in src is written using newer features of JavaScript
and then transpiled, you'll want to use an IDE that supports source maps when debugging.
We have instructions for running KillrVideo in a couple popular IDEs:
Running in WebStorm
To debug in WebStorm, you'll first need to create a Run/Debug configuration.
- Open the root project folder with WebStorm.
- Follow the instructions from JetBrains to create a new Node.js debug
configuration. For the JavaScript File property, use the transpiled main entry point for
the application which is
/dist/index.js. - Launch the debugging configuration you just created.
Running in Visual Studio Code
The repository you cloned has a .vscode folder checked-in. The launch.json file contains
a task named Launch that can be used by Visual Studio Code to launch the transpiled code
in the dist folder with a debugger attached.
- Open the root project folder with Visual Studio Code.
- Press
F5to start the Launch task which will start the application and debugger.
Opening the Web UI
When KillrVideo starts, you'll see a bunch of log output to the console telling you about the various things it's doing. You should see output that looks something like this:
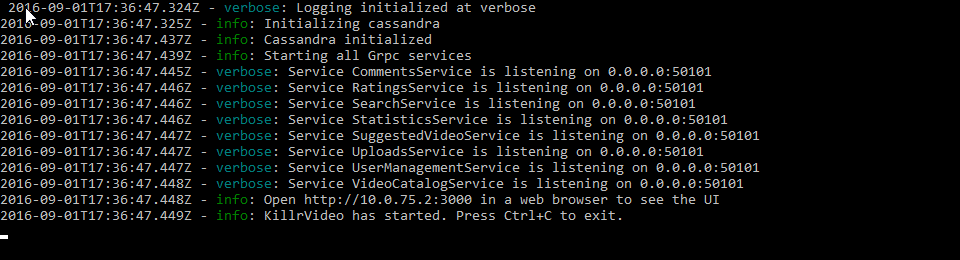
One of the last lines in the log output will tell you where to open a web browser in order to
see the web application. The web UI makes calls to the Node.js microservices running on your
local machine. Look in the /src/services folder to explore the service code and add
breakpoints.
Note: Breakpoints, Source Maps, and Transpiled Code
Remember, because we're using new language features from the latest version of JavaScript (i.e. ES 2016), the code in the
srcfolder was transpiled and output to thedistfolder when you did thenpm run buildstep above. That build step also outputs source maps into thedistfolder. So long as the IDE or debugger that you're using supports source maps, you should place your breakpoints in the original source files undersrc.
As you interact with the web UI, you'll trigger those breakpoints in the service code.
Using DataStax Studio
The docker-compose file that you ran above started an instance of DataStax Studio,
an interactive tool for querying, exploring, analyzing, and visualizing both graph and tabular data.
Check out the Using DataStax Studio page for more information.
Learn More
Check out the Documentation section for a lot more information on the architecture of KillrVideo and how the Web Tier interacts with the microservices running on your machine.